

22 August 2019
United States Aging Data Sheet 2019
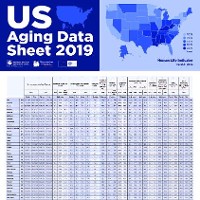
This data sheet uses the United States Mortality DataBase to analyze aging across US states by: (1) contrasting conventional measures of aging with new ones based on The Characteristics Approach to the Measurement of Population Aging, and (2) providing new measures that are particularly appropriate for the current US context.
The US Context
In March 2010, the US government passed the Affordable Care Act, popularly known as ObamaCare. Insurance provisions under that Act differed by state. In addition, some states expanded Medicaid (health insurance coverage for low-income people) and some did not. For example, Colorado expanded Medicaid and Wyoming did not. The US has recently been experiencing a wave of opioid overdose deaths. Opioid overdoses have been far more common in some states than others. For example, death rates from those overdoses have been particularly high in West Virginia, Ohio, and Maine and particularly low in California and Texas. This Datasheet shows the effects of the Affordable Care Act and opioid overdose deaths on population aging across US states.
The Characteristics Approach to the Measurement of Population Aging
The Characteristics Approach takes the changing characteristics of groups of people, such as life expectancy, physical health, cognitive functioning, etc., into account, and allows the construction of new, multidimensional measures of aging. These new measures provide novel perspectives on important policy questions. The Characteristics Approach produces more accurate measure of population aging. The widely used measures of population aging, the old-age dependency ratio and the median age of the population, overestimate the speed of aging. The Characteristic Approach produces Constant Characteristic Ages for a wide variety of characteristics. The transformation of characteristics into a single metric, age, allows for a consistent multidimensional understanding of population aging.
Policy-Relevant Measures
An Intergenerationally Equitable Normal Pension Starting from a normal pension age of 65 for the US as a whole in 1970, the data sheet shows how an intergenerationally equitable pension age would differ across states and change over time.
Equal Survivorship Age
Most deaths from opioid overdoses have occurred at ages where labor force participation rates are the highest. In each state, the survival rate from age 20 to the equal Survivorship age is the same as the survival rate from age 20 to age 65 in the US as a whole. Differences across states and changes over time in the equal Survivorship age show the effects of the opioid epidemic and policies to combat it.
Background
The work on the data sheet was lead by World Population Deputy Program Director Sergei Scherbov, expert in this fields of demographic modelling, population projections, data processing and presentation, and measuring aging. Together with Warren C. Sanderson, Scherbov has developed new methods of the analysis of aging that take characteristics of people into account. Their research has been published in major scientific journals, including Nature and Science. He is currently Principal Investigator of the European Research Council funded Reassessing Ageing from a Population Perspective (Re-Ageing) project at IIASA that, among other things, ascertains the extent to which advanced societies are actually aging in multiple dimensions, including health, cognitive abilities, and longevity.
IIASA Re-Aging Project
PUBLICATIONS
Previous Data Sheets
Russian Demographic Data Sheet 2016,2019; Aging Data Sheet 2018; European Demographic Data Sheet 2018,2016