

15 July 2021
Tracking COVID-19 across Europe
While many comparisons have been made between the COVID-19 pandemic and similar events in history, one thing sets this pandemic apart from others: the unprecedented amount of knowledge and data that is constantly being generated to understand how the pandemic is unfolding. For a high-income region like Europe, the quality of information made available on a daily basis is exceptionally high compared to the rest of the world. Using this information to make comparisons between different European countries is however not a simple task.
Almost all European countries make COVID-19 data available in the form of maps and trend graphs, but access to data behind these visualizations varies from country to country, with most allowing some form of access to regional data, while others do not release this information publicly. European countries also tend to define regions differently. The European Commission and Eurostat - the statistical office of the European Union – for instance, use homogenous units known as Nomenclature of Territorial Units for Statistics (NUTS), where NUTS 0 denotes countries, NUTS 1 are typically provinces, NUTS 2 are districts, and NUTS 3 are sub-districts. In addition, differences in testing practices and how COVID-19 related hospital admissions and deaths are recorded, further complicate the comparison of data. Lastly, not all European countries are part of the European Union, and therefore are not subject to Eurostat reporting or data sharing requirements.
To overcome some of these challenges, IIASA researcher Asjad Naqvi has developed a COVID-19 tracker that presents data on daily COVID-19 cases at the sub-national level for 26 European countries from January 2020 until the present. Although several innovative datasets that collect unique COVID-19 related information, such as the Oxford COVID-19 Government Response Tracker and the Complexity Science Hub (CSH) Tracker have come onto the scene since the start of the pandemic, Naqvi’s tracker aims to identify, collect, and collate various official regional datasets for European countries, while also combining and homogenizing the data at the NUTS 3 or NUTS 2 level. This homogenized dataset makes it possible to explore how the virus spreads in terms of cumulative cases, daily cases, and cases per capita in Europe at a daily resolution.
“One of my aims in developing this tracker was to ensure data transparency, while also making the data consistent and ready for analysis. The paper identifies sources of COVID-19 datasets for 26 European countries and how to access each of them. The data set currently contains over 0.5 million data points at the NUTS 3 or NUTS 2 level,” Naqvi explains.
The tracker’s data, which is discussed in a new paper published in the journal Nature Scientific Data, can be merged with country or continent-level datasets, such as primary surveys, data from national statistical offices, or data from Eurostat, to conduct comprehensive analyses on the causes and implications of COVID-19. The paper contains a detailed discussion of data sources in each country, including their strengths and weaknesses, and the raw country-level files are provided in an online repository. According to Naqvi, this is one of the very few datasets that has been continuously updated since August 2020 to provide consistent daily information on a regional level for Europe.
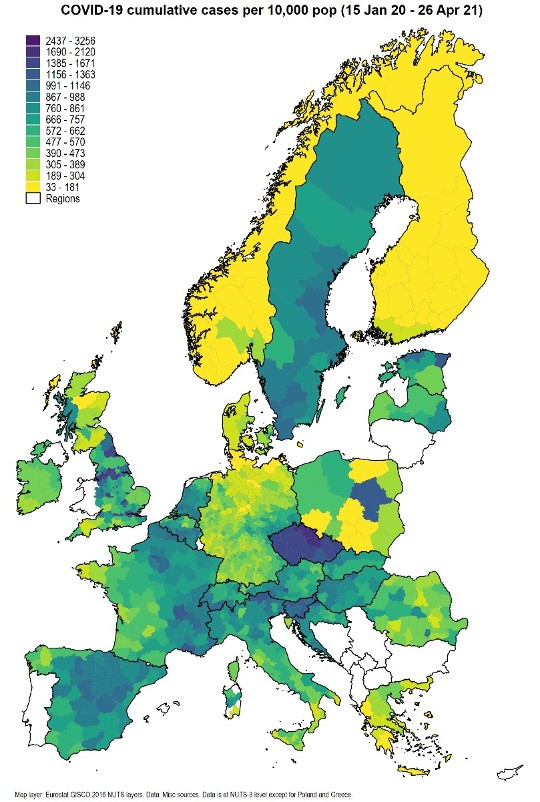
The map below, for example, clearly illustrates that Germany, on the whole, insulated itself well against the virus and that Sweden and Czechia were particularly hard hit since the start of the pandemic.
Naqvi notes that the tracker can be used for a host of different research questions. It can, for instance, be mapped onto NUTS-level regional data including various economic, demographic, health, tourism, and labor related indicators, some of which also have a monthly or even a weekly frequency. Since data for individual countries are provided, a detailed country-specific analysis can also be done if regional or micro data are available for analysis. Other datasets catalogued on platforms such as the Oxford COVID-19 Supertracker, provides a range of interesting information on various policies put in place by countries during the pandemic. The tracker data can be combined with several innovative global datasets containing NUTS-level information for European countries. As the data for the tracker has a Creative Commons Attribution 4.0 International License (CC-BY), anyone can access it at any time. The data base will continue to be updated regularly until countries stop publishing regional COVID-19 data.
Reference
Naqvi, A. (2021). COVID-19 European regional tracker. Scientific Data DOI: 10.1038/s41597-021-00950-7 [pure.iiasa.ac.at/17327]
Further information


NEWS
"Climate Modernity" - The 24H Challenge: How do we want to live and act in the future in Styria ?
Health fears can increase pandemic isolation habits in older Europeans
How circular waste management systems can benefit the environment
Launch of the Northern African Applied Systems Analysis Centre
How we measure the effects of methane matters for climate policy